There are two inches of snow on the ground that should be cleared by 9:30 am. The COVID outlook for today is yellow. If you’re not boosted, then you should grab your mask on your way out the door. There is an accident on I-90 at exit 68, so you may want to consider alternate routes.
Is this the new normal? Will we learn to check disease forecasts as casually as weather and traffic reports?
As we enter the third year of this pandemic, Omicron has many Americans apprehensive about the coming year. The chronic anxiety of an ongoing crisis has supplanted the blind terror of the virus’s deadly arrival.
Prior to the emergence of Omicron, Delta caused large spikes in cases and hospitalizations in the American South, with the greatest impact on the unvaccinated. We are still in the midst of a Delta wave, but now it’s rippling across the Northeast, West, and Midwestern states, with hospitals in Michigan, Minnesota, Pennsylvania and others operating at or near maximum capacity. Omicron could overtax already stressed health systems, not least because it is estimated to be 2-4x more transmissible than Delta, and ~30% of cases are breakthrough cases.
Early evidence suggests that Omicron may be more transmissible than previous strains because of how it infects individuals, causing infection in the bronchus, the tubes that carry air into your lungs, rather than the lungs themselves. If Omicron infections are acting on the upper respiratory system, as early data suggest, then it may not cause the same damaging lung infections as previous strains.
The emergence of a new variant is scary, but experts are optimistic that Omicron is the next step towards an endemic phase of COVID-19. As you can see in the graphs below, daily cases will likely exceed previous highs, but our expectation is that cases will be milder because of Omicron’s unique features and increased immunity in the overall population.
What does this mean for you? As much as we all wish it were the case, COVID isn’t over. The virus is entering 2022 alongside us. That said, we’ve learned that masking is an effective way to prevent infection, we have effective vaccines and boosters, population immunity is higher than it’s ever been, and new variants are evolving. Our behavior is evolving as well, and a future where you receive disease, weather, and traffic push notifications every morning may not be far off. In the meantime, if you’re curious about the personal COVID-19 risks you face, check out our free assessment tool.
These changing risk factors shape the economy just as they shape our individual lives. Businesses are making crucial decisions about staffing, travel, and strategy for the coming year. Over the past few months, we’ve run hundreds of risk assessments for clients to ensure the events they’re convening are safe—assessments that include detailed projections for the host city and empower organizers to operate with proper health and safety protocols and prepare attendees and exhibitors with up-to-date information on the trajectory of the pandemic. We’ve also published studies quantifying the impact of various return-to-office strategies, and our platform is powering third-party data science efforts to simulate the future course of the pandemic.
So what should you expect to see over the coming months?
The Epistemix Spring 2022 COVID-19 Forecast
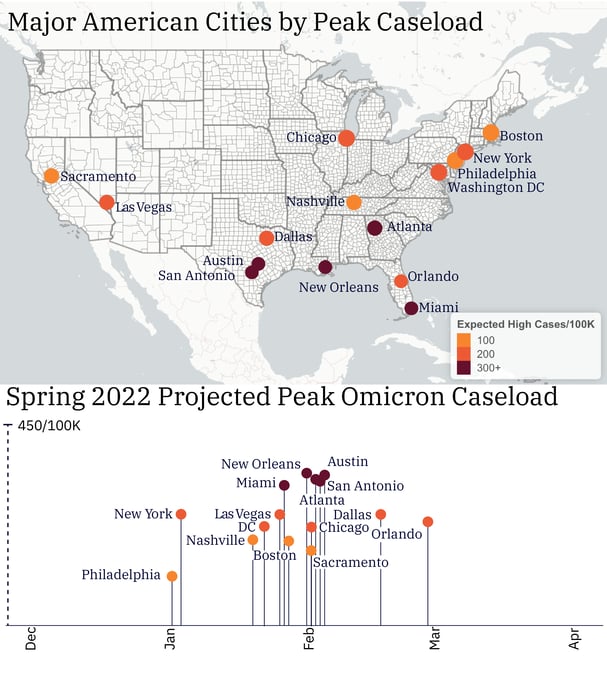
To show how and when Omicron could impact you this Spring, we compiled forecasts for sixteen of the top destinations in the United States. You can see peak caseload estimates, and how the Omicron wave differs from the prior Delta wave. We also discuss differences between cities and note current vaccination levels, uptake rate of boosters, and projected population immunity as of January 20, 2022. Just like the morning weather forecast lets you know when to bring a raincoat, our forecast will help you decide when to grab your mask or change your plans.
Each forecast begins with a model that is fine-tuned for each city. This includes historical data on previous infections, hospitalizations, and deaths as well as the number of partially vaccinated, fully vaccinated, and boosted individuals. The timing of these infections and vaccinations are important because they determine the level of immunity in each individual and the susceptibility to infection in the population overall at any point in time.
After calibrating the model, we made a projection using the latest data about Omicron as of January 20, 2022 and then compared the cases, hospitalizations, and deaths for each city as well as noting the day of peak caseload. The peak day differs for each region due to seasonality patterns that create regional trends of respiratory infections. We expect the peak hospitalizations and deaths to be after the day of peak caseload.
Regional Trends
In the South and Southwest, cases will increase dramatically starting in January. We project that there will be explosive case numbers as high as 10,000 cases per day. In Orlando, this is 5x higher than any day during the pandemic so far. As we have seen thus far in the Omicron wave, we are seeing a sharp peak with a quick rise and fall in cases as shown for Atlanta, GA.

Time series of COVID-19 case numbers (seven-day moving average) from July 2021 to April 2022 for Atlanta and Philadelphia. Reported values are shown in gray (Center for Systems Science and Engineering (CSSE) at Johns Hopkins University, 2021). The colored line shows the number of cases predicted by our simulation model.
For the Northeast (New York, Philadelphia, and Boston), expect a peak in late January/early February. Cases will increase through January but will begin decreasing in early February. Expect case numbers to stay mid-high through February and reach a low point again in April or May.
For the West (Sacramento), expect a peak in February and a slow, steady decrease until April. Cases may stay high for about 3 weeks before they decline.
City Forecasts
Scroll down to see specific COVID-19 forecasts for Austin, Atlanta, Boston, Chicago Dallas, Las Vegas, Miami, Nashville, New Orleans, New York, Orlando, Philadelphia, Sacramento, San Antonio, and Washington, DC.
Austin, TX
The 2020/2021 winter wave in Austin peaked on January 19, 2021. Cases steadily declined until reaching a minimum in June. A new wave of cases due to the increasing dominance of the Delta variant of SARS-CoV-2 began in July 2021. At its peak, the Delta wave produced approximately 1,000 new reported cases of COVID-19 per day in Austin.
As of January 20, 2022:
- 67% of Austin residents have completed their full course of COVID-19 vaccinations
- 321,000 residents (19% of the population) have received booster shots
An individual’s immunity to SARS-CoV-2 is influenced by both their vaccination history and whether or not they have previously been infected with the disease. Population-level immunity to SARS-CoV-2 (or ‘resiliency’) can be estimated using our model. Each simulated individual in the model has a resistance to infection by each strain of SARS-CoV-2 represented by a percentage. The population-level immunity of Austin residents is the average resistance to infection across all agents and strains, taking into account the prevalence of each strain. We estimate that Austin has 69% immunity to SARS-CoV-2 As of January 20, 2022. This is a medium level of immunity compared to other modeled locations in the United States.
We have used our COVID-19 model to create a projection of the number of cases in Austin during Q1 2022. Previously, we had modeled different relative transmissibilities of the Omicron variant. Since the original release of this blog post, more information has been released about the relative transmissibility and effectiveness of vaccines for the Omicron variant. Therefore we have run a single scenario for Q1 2022, where the Omicron variant is 1.6 times as transmissible as the Delta variant and vaccines are 10%-75% as effective at preventing transmission compared to the original strain. In this scenario we predict that the peak number of cases will occur at the beginning of February 2022. The maximum number of daily cases predicted by the model is ~5,600 cases per day.
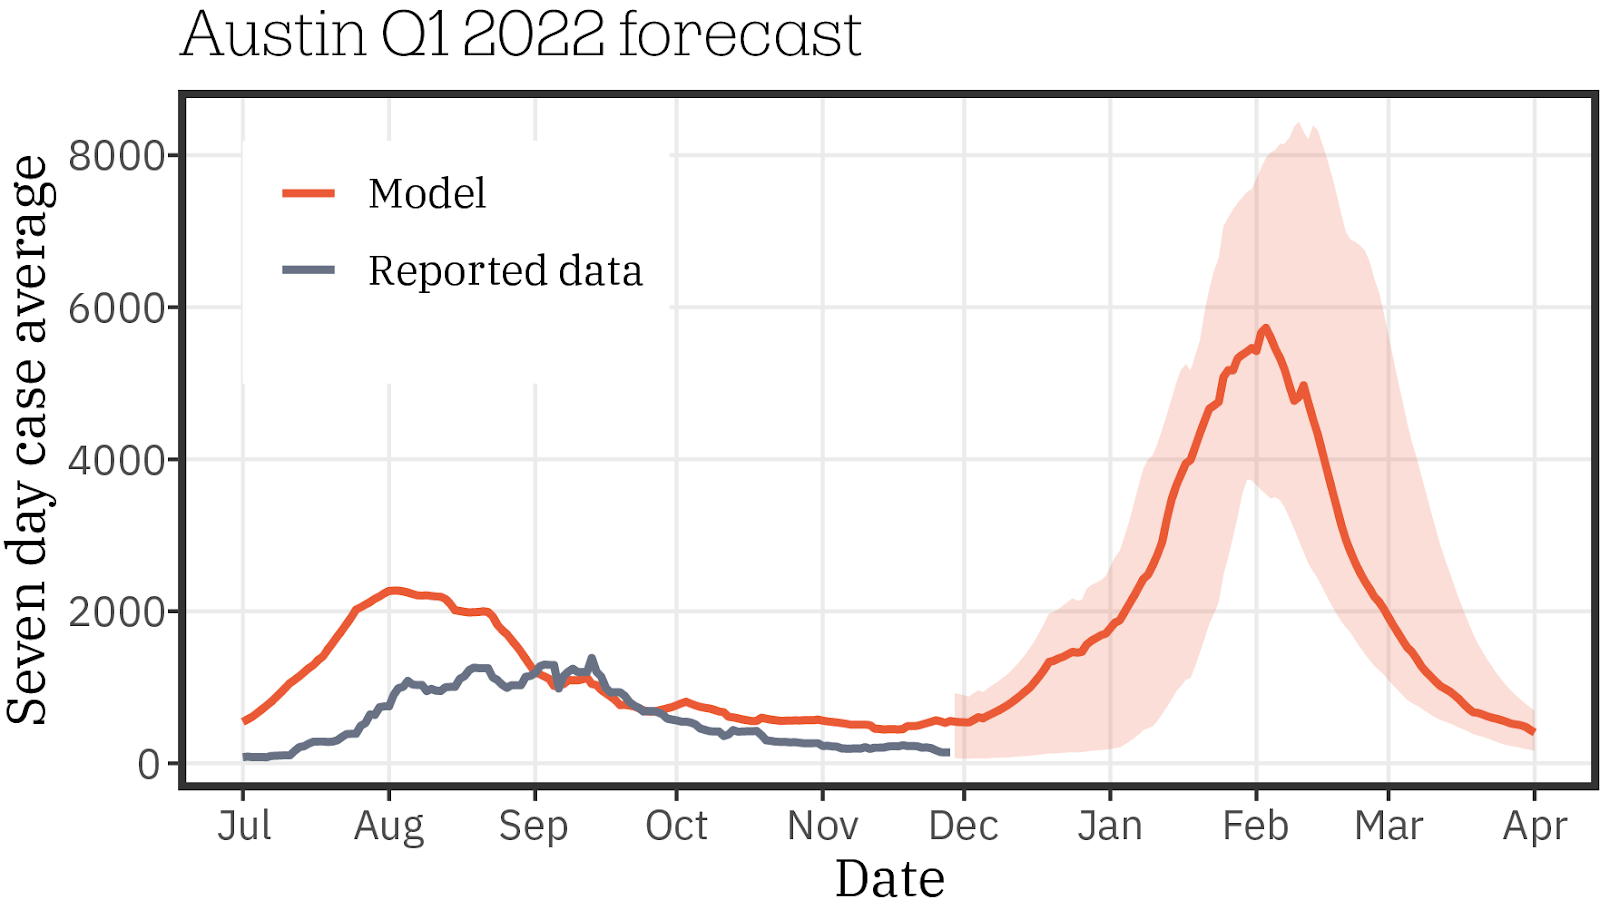
Time series of COVID-19 case numbers (seven-day moving average) from July 2021 to April 2022 for Austin, TX. Reported values are shown in gray (Center for Systems Science and Engineering (CSSE) at Johns Hopkins University, 2021). The colored line shows the number of cases predicted by our simulation model.
Atlanta, GA
The 2020/2021 winter wave in Atlanta peaked on January 13, 2021. Cases steadily declined until reaching a minimum in June. A new wave of cases due to the increasing dominance of the Delta variant of SARS-CoV-2 began in July 2021. At its peak, the Delta wave produced approximately 700 new reported cases of COVID-19 per day in Atlanta.
As of January 20, 2022:
- 50% of Atlanta residents have completed their full course of COVID-19 vaccinations
- 815,000 residents (15% of the population) have received booster shots
An individual’s immunity to SARS-CoV-2 is influenced by both their vaccination history and whether or not they have previously been infected with the disease. Population-level immunity to SARS-CoV-2 (or ‘resiliency’) can be estimated using our model. Each simulated individual in the model has a resistance to infection by each strain of SARS-CoV-2 represented by a percentage. The population-level immunity of Atlanta residents is the average resistance to infection across all agents and strains, taking into account the prevalence of each strain. We estimate that Atlanta has 70% immunity to SARS-CoV-2 As of January 20, 2022. This is a medium level of immunity compared to other modeled locations in the United States.
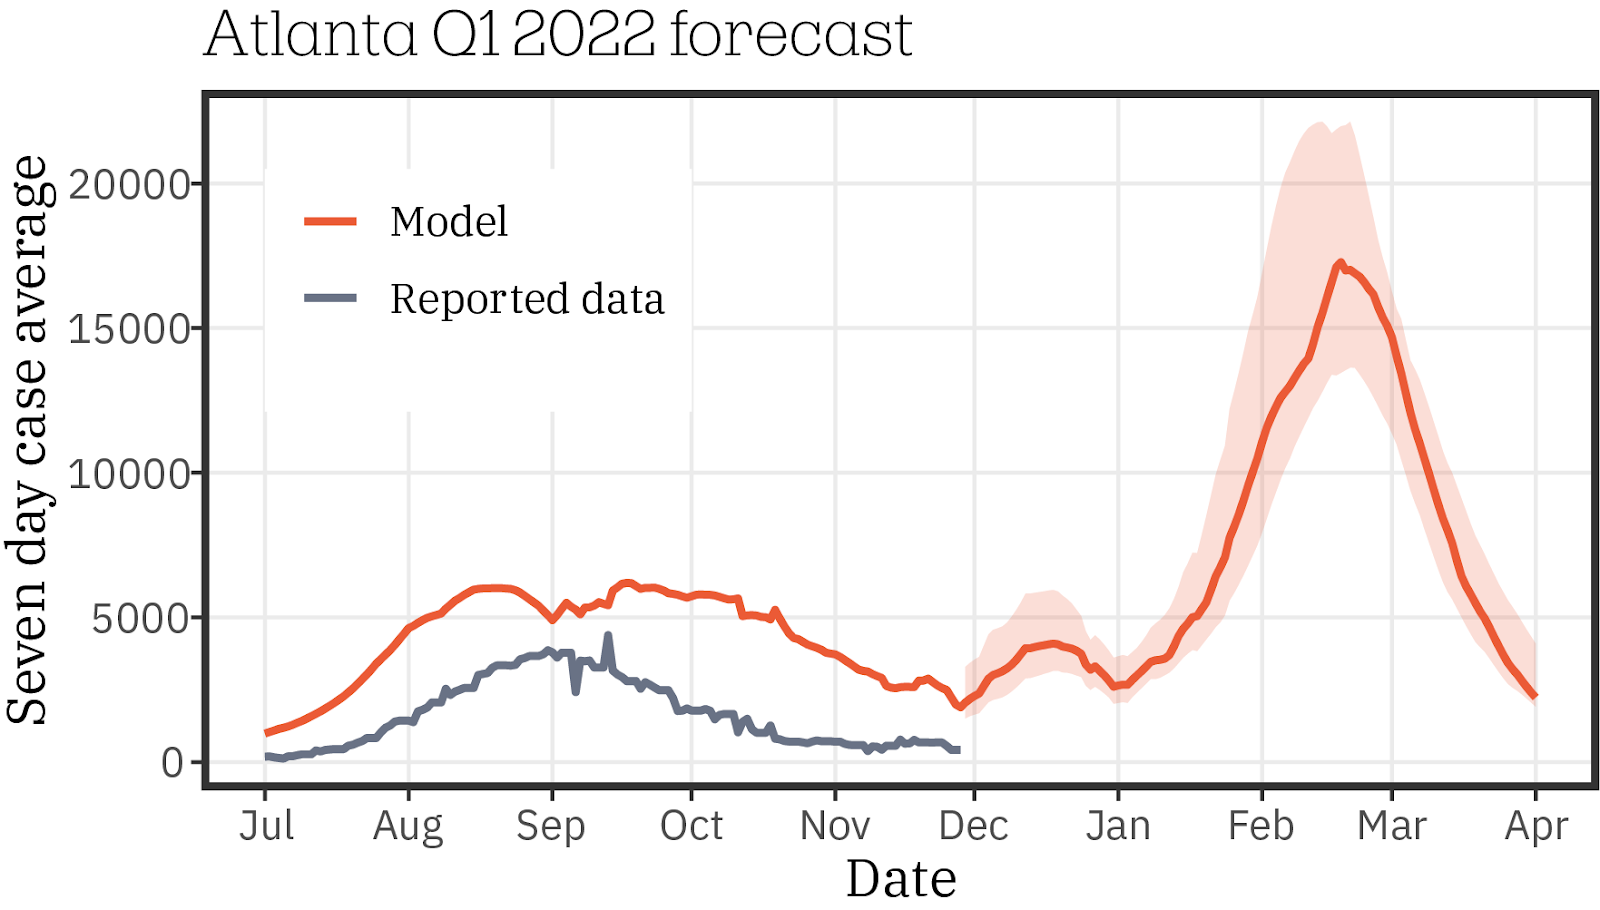
We have used our COVID-19 model to create a projection of the number of cases in Atlanta during Q1 2022. Previously, we had modeled different relative transmissibilities of the Omicron variant. Since the original release of this blog post, more information has been released about the relative transmissibility and effectiveness of vaccines for the Omicron variant. Therefore we have run a single scenario for Q1 2022, where the Omicron variant is 1.6 times as transmissible as the Delta variant and vaccines are 10%-75% as effective at preventing transmission compared to the original strain. In this scenario we predict that the peak number of cases will occur in the middle of February 2022. The maximum number of daily cases predicted by the model is ~17,500 cases per day.

Time series of COVID-19 case numbers (seven-day moving average) from July 2021 to April 2022 for Atlanta, GA. Reported values are shown in gray (Center for Systems Science and Engineering (CSSE) at Johns Hopkins University, 2021). The colored line shows the number of cases predicted by our simulation model.
Las Vegas, NV
The 2020/2021 winter wave in Las Vegas peaked on January 14, 2021. Cases declined sharply through March and reached a minimum in June. A new wave of cases due to the increasing dominance of the Delta variant of SARS-CoV-2 began in July 2021. At its peak, the Delta wave produced approximately 900 new reported cases of COVID-19 per day in Las Vegas.
As of January 20, 2022:
- 55% of Las Vegas residents have completed their full course of COVID-19 vaccinations
- 350,000 residents (18% of the population) have received booster shots
An individual’s immunity to SARS-CoV-2 is influenced by both their vaccination history and whether or not they have previously been infected with the disease. Population-level immunity to SARS-CoV-2 (or ‘resiliency’) can be estimated using our model. Each simulated individual in the model has a resistance to infection by each strain of SARS-CoV-2 represented by a percentage. The population-level immunity of Las Vegas residents is the average resistance to infection across all agents and strains, taking into account the prevalence of each strain. We estimate that Las Vegas has 76% immunity to SARS-CoV-2 As of January 20, 2022. This is a high level of immunity compared to other modeled locations in the United States.
We have used our COVID-19 model to create a projection of the number of cases in Las Vegas during Q1 2022. Previously, we had modeled different relative transmissibilities of the Omicron variant. Since the original release of this blog post, more information has been released about the relative transmissibility and effectiveness of vaccines for the Omicron variant. Therefore we have run a single scenario for Q1 2022, where the Omicron variant is 1.6 times as transmissible as the Delta variant and vaccines are 10%-75% as effective at preventing transmission compared to the original strain. In this scenario we predict that the peak number of cases will occur at the end of January 2022. The maximum number of daily cases predicted by the model is ~4,900 cases per day.

Time series of COVID-19 case numbers (seven-day moving average) from July 2021 to April 2022 for Las Vegas, NV. Reported values are shown in gray (Center for Systems Science and Engineering (CSSE) at Johns Hopkins University, 2021). The colored line shows the number of cases predicted by our simulation model.
Miami, FL
The 2020/2021 winter wave in Miami peaked on January 8, 2021. Cases declined from January to March, and then remained steady until the end of June. A new wave of cases due to the increasing dominance of the Delta variant of SARS-CoV-2 began in July 2021. At its peak, the Delta wave produced approximately 3,000 reported cases of COVID-19 per day in Miami.
As of January 20, 2022:
- 82% of Miami residents have completed their full course of COVID-19 vaccinations
- 537,000 residents (22% of the population) have received booster shots
An individual’s immunity to SARS-CoV-2 is influenced by both their vaccination history and whether or not they have previously been infected with the disease. Population-level immunity to SARS-CoV-2 (or ‘resiliency’) can be estimated using our model. Each simulated individual in the model has a resistance to infection by each strain of SARS-CoV-2 represented by a percentage. The population-level immunity of Miami residents is the average resistance to infection across all agents and strains, taking into account the prevalence of each strain. We estimate that Miami has 72% immunity to SARS-CoV-2 As of January 20, 2022. This is a medium level of immunity compared to other modeled locations in the United States.
We have used our COVID-19 model to create a projection of the number of cases in Miami during Q1 2022. Previously, we had modeled different relative transmissibilities of the Omicron variant. Since the original release of this blog post, more information has been released about the relative transmissibility and effectiveness of vaccines for the Omicron variant. Therefore we have run a single scenario for Q1 2022, where the Omicron variant is 1.6 times as transmissible as the Delta variant and vaccines are 10%-75% as effective at preventing transmission compared to the original strain. In this scenario we predict that the peak number of cases will occur at the end of January 2022. The maximum number of daily cases predicted by the model is ~7,900 cases per day.

Time series of COVID-19 case numbers (seven-day moving average) from July 2021 to April 2022 for Miami, FL. Reported values are shown in gray (Center for Systems Science and Engineering (CSSE) at Johns Hopkins University, 2021). The colored line shows the number of cases predicted by our simulation model.
Nashville, TN
The 2020/2021 winter wave in Nashville peaked on December 20, 2021. Cases declined sharply then stayed low but steady through March, reaching a year-long low in June. A new wave of cases due to the increasing dominance of the Delta variant of SARS-CoV-2 began in July 2021. At its peak, the Delta wave produced approximately 1,000 new reported cases of COVID-19 per day in Nashville.
As of January 20, 2022:
- 63% of Nashville residents have completed their full course of COVID-19 vaccinations
- 294,800 residents (18% of the population) have received booster shots
An individual’s immunity to SARS-CoV-2 is influenced by both their vaccination history and whether or not they have previously been infected with the disease. Population-level immunity to SARS-CoV-2 (or ‘resiliency’) can be estimated using our model. Each simulated individual in the model has a resistance to infection by each strain of SARS-CoV-2 represented by a percentage. The population-level immunity of Nashville residents is the average resistance to infection across all agents and strains, taking into account the prevalence of each strain. We estimate that Nashville has 68% immunity to SARS-CoV-2 As of January 20, 2022. This is a medium level of immunity compared to other modeled locations in the United States.
We have used our COVID-19 model to create a projection of the number of cases in Nashville during Q1 2022. Previously, we had modeled different relative transmissibilities of the Omicron variant. Since the original release of this blog post, more information has been released about the relative transmissibility and effectiveness of vaccines for the Omicron variant. Therefore we have run a single scenario for Q1 2022, where the Omicron variant is 1.6 times as transmissible as the Delta variant and vaccines are 10%-75% as effective at preventing transmission compared to the original strain. In this scenario we predict that the peak number of cases will occur at the end of January 2022. The maximum number of daily cases predicted by the model is ~3,300 cases per day.

Time series of COVID-19 case numbers (seven-day moving average) from July 2021 to April 2022 for Nashville, TN. Reported values are shown in gray (Center for Systems Science and Engineering (CSSE) at Johns Hopkins University, 2021). The colored line shows the number of cases predicted by our simulation model.
New Orleans, LA
The 2020/2021 winter wave in New Orleans peaked on January 15, 2021. Cases then declined throughout January and February, reaching a minimum in March. Cases held steady through June before a new wave of cases due to the increasing dominance of the Delta variant of SARS-CoV-2 began in July. At its peak, the Delta wave produced approximately 500 new reported cases of COVID-19 per day in New Orleans.
As of January 20, 2022:
- 67% of New Orleans residents have completed their full course of COVID-19 vaccinations
- 195,335 residents (17% of the population) have received booster shots
An individual’s immunity to SARS-CoV-2 is influenced by both their vaccination history and whether or not they have previously been infected with the disease. Population-level immunity to SARS-CoV-2 (or ‘resiliency’) can be estimated using our model. Each simulated individual in the model has a resistance to infection by each strain of SARS-CoV-2 represented by a percentage. The population-level immunity of New Orleans residents is the average resistance to infection across all agents and strains, taking into account the prevalence of each strain. We estimate that New Orleans has 65% immunity to SARS-CoV-2 As of January 20, 2022. This is a low level of immunity compared to other modeled locations in the United States.
We have used our COVID-19 model to create a projection of the number of cases in New Orleans during Q1 2022. Previously, we had modeled different relative transmissibilities of the Omicron variant. Since the original release of this blog post, more information has been released about the relative transmissibility and effectiveness of vaccines for the Omicron variant. Therefore we have run a single scenario for Q1 2022, where the Omicron variant is 1.6 times as transmissible as the Delta variant and vaccines are 10%-75% as effective at preventing transmission compared to the original strain. In this scenario we predict that the peak number of cases will occur at the end of January 2022. The maximum number of daily cases predicted by the model is ~4,100 cases per day.

Time series of COVID-19 case numbers (seven-day moving average) from July 2021 to April 2022 for New Orleans, LA. Reported values are shown in gray (Center for Systems Science and Engineering (CSSE) at Johns Hopkins University, 2021). The colored line shows the number of cases predicted by our simulation model.
New York, NY
The 2020/2021 winter wave in New York County peaked in March of 2021. Cases declined slowly until reaching a year-long low in June. A new wave of cases due to the increasing dominance of the Delta variant of SARS-CoV-2 began in July 2021. At its peak, the Delta wave produced approximately 2,000 new reported cases of COVID-19 per day in New York County.
As of January 20, 2022:
- 75% of New York County residents have completed their full course of COVID-19 vaccinations
- 379,865 residents (24% of the population) have received booster shots
An individual’s immunity to SARS-CoV-2 is influenced by both their vaccination history and whether or not they have previously been infected with the disease. Population-level immunity to SARS-CoV-2 (or ‘resiliency’) can be estimated using our model. Each simulated individual in the model has a resistance to infection by each strain of SARS-CoV-2 represented by a percentage. The population-level immunity of New York County residents is the average resistance to infection across all agents and strains, taking into account the prevalence of each strain. We estimate that New York County has 69% immunity to SARS-CoV-2 As of January 20, 2022. This is a medium level of immunity compared to other modeled locations in the United States.
We have used our COVID-19 model to create a projection of the number of cases in New York during Q1 2022. Previously, we had modeled different relative transmissibilities of the Omicron variant. Since the original release of this blog post, more information has been released about the relative transmissibility and effectiveness of vaccines for the Omicron variant. Therefore we have run a single scenario for Q1 2022, where the Omicron variant is 1.6 times as transmissible as the Delta variant and vaccines are 10%-75% as effective at preventing transmission compared to the original strain. In this scenario we predict that the peak number of cases will occur in early January 2022. The maximum number of daily cases predicted by the model is ~3,900 cases per day.
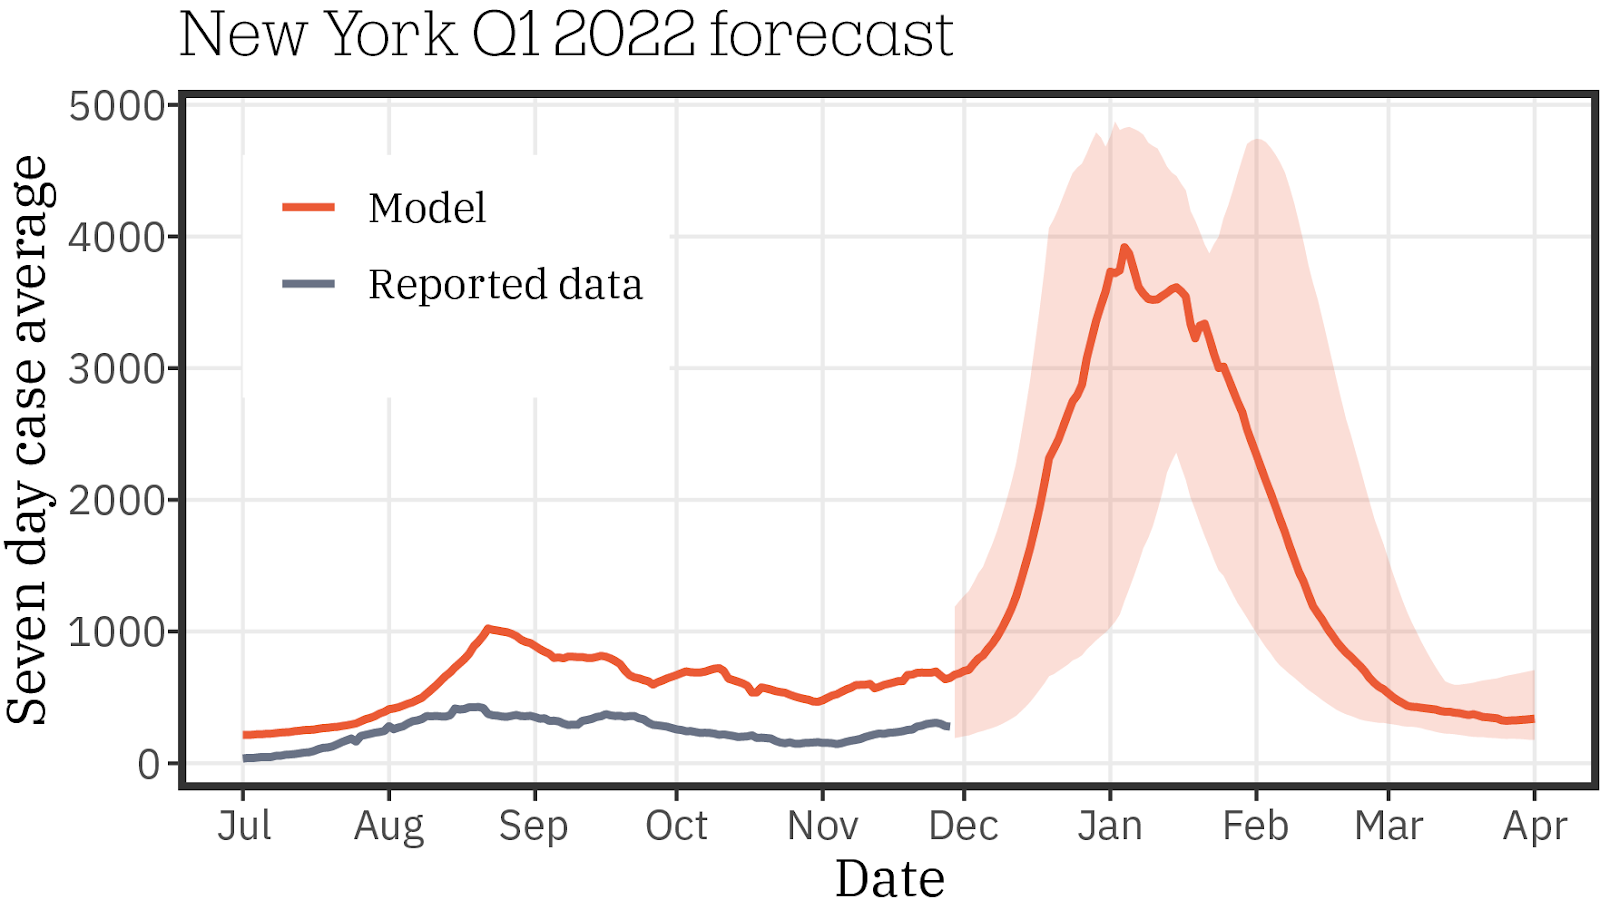
Time series of COVID-19 case numbers (seven-day moving average) from July 2021 to April 2022 for New York, NY. Reported values are shown in gray (Center for Systems Science and Engineering (CSSE) at Johns Hopkins University, 2021). The colored line shows the number of cases predicted by our simulation model.
Orlando, FL
The 2020/2021 winter wave in Orlando peaked on January 15, 2021. Cases then declined throughout the spring, reaching a minimum in June. In the late summer, a new wave of cases due to the increasing dominance of the Delta variant of SARS-CoV-2 began in July. Over the last few months, cases and hospitalizations have been steadily decreasing, reaching a low point in mid December 2021.
As of January 20, 2022:
- 67% of Orlando residents have completed their primary course of COVID-19 vaccinations
- 463,302 residents (22% of the population) have received booster shots
An individual’s immunity to SARS-CoV-2 is influenced by both their vaccination history and whether or not they have previously been infected with the disease. Population-level immunity to SARS-CoV-2 (or ‘resiliency’) can be estimated using our model. Each simulated individual in the model has a resistance to infection by each strain of SARS-CoV-2 represented by a percentage. The population-level immunity of Orlando residents is the average resistance to infection across all agents and strains, taking into account the prevalence of each strain. We estimate that Orlando has 75% immunity to SARS-CoV-2 As of January 20, 2022. This is a medium level of immunity compared to other modeled locations in the United States. This level of immunity offers a “medium” level of protection to the population, significantly hampering the rate of new infections, but not enough to prevent future waves.
We have used our COVID-19 model to create a projection of the number of cases in Orlando during Q1 2022. Previously, we had modeled different relative transmissibilities of the Omicron variant. Since the original release of this blog post, more information has been released about the relative transmissibility and effectiveness of vaccines for the Omicron variant. Therefore we have run a single scenario for Q1 2022, where the Omicron variant is 1.6 times as transmissible as the Delta variant and vaccines are 10%-75% as effective at preventing transmission compared to the original strain. In this scenario we predict that the peak number of cases will occur at the end of February 2022. The maximum number of daily cases predicted by the model is ~5,100 cases per day.

Time series of COVID-19 case numbers (seven-day moving average) from July 2021 to April 2022 for Orlando, FL. Reported values are shown in gray (Center for Systems Science and Engineering (CSSE) at Johns Hopkins University, 2021). The colored line shows the number of cases predicted by our simulation model.
Philadelphia, PA
The 2020/2021 winter wave in Philadelphia peaked first on December 8, 2020 and again on January 9, 2021. Cases declined sharply until late February, rose again through April, then declined steadily until reaching a minimum in June. A new wave of cases due to the increasing dominance of the Delta variant of SARS-CoV-2 began in July 2021. At its peak, the Delta wave produced approximately 500 new reported cases of COVID-19 per day in Philadelphia.
As of January 20, 2022:
- 64% of Philadelphia residents have completed their full course of COVID-19 vaccinations
- 785,671 residents (24% of the population) have received booster shots
An individual’s immunity to SARS-CoV-2 is influenced by both their vaccination history and whether or not they have previously been infected with the disease. Population-level immunity to SARS-CoV-2 (or ‘resiliency’) can be estimated using our model. Each simulated individual in the model has a resistance to infection by each strain of SARS-CoV-2 represented by a percentage. The population-level immunity of Philadelphia residents is the average resistance to infection across all agents and strains, taking into account the prevalence of each strain. We estimate that Philadelphia has 72% immunity to SARS-CoV-2 As of January 20, 2022. This is a medium level of immunity compared to other modeled locations in the United States.
We have used our COVID-19 model to create a projection of the number of cases in Philadelphia during Q1 2022. Previously, we had modeled different relative transmissibilities of the Omicron variant. Since the original release of this blog post, more information has been released about the relative transmissibility and effectiveness of vaccines for the Omicron variant. Therefore we have run a single scenario for Q1 2022, where the Omicron variant is 1.6 times as transmissible as the Delta variant and vaccines are 10%-75% as effective at preventing transmission compared to the original strain. In this scenario we predict that the peak number of cases occurred at the end of December 2021. The maximum number of daily cases predicted by the model is ~3,900 cases per day.

Time series of COVID-19 case numbers (seven-day moving average) from July 2021 to April 2022 for Philadelphia, PA. Reported values are shown in gray (Center for Systems Science and Engineering (CSSE) at Johns Hopkins University, 2021). The colored line shows the number of cases predicted by our simulation model.
Sacramento, CA
The 2020/2021 winter wave in Sacramento peaked on January 16, 2021. Cases declined sharply, reaching a minimum on February 18. Cases stayed low and steady through spring and summer before a new wave of cases due to the increasing dominance of the Delta variant of SARS-CoV-2 began in July 2021. At its peak, the Delta wave produced approximately 1,100 new reported cases of COVID-19 per day in Sacramento.
As of January 20, 2022:
- 64% of Sacramento residents have completed their full course of COVID-19 vaccinations
- 308,061 (22% of the population) have received booster shots
An individual’s immunity to SARS-CoV-2 is influenced by both their vaccination history and whether or not they have previously been infected with the disease. Population-level immunity to SARS-CoV-2 (or ‘resiliency’) can be estimated using our model. Each simulated individual in the model has a resistance to infection by each strain of SARS-CoV-2 represented by a percentage. The population-level immunity of Sacramento residents is the average resistance to infection across all agents and strains, taking into account the prevalence of each strain. We estimate that Sacramento has 87% immunity to SARS-CoV-2 As of January 20, 2022. This is a medium level of immunity compared to other modeled locations in the United States.
We have used our COVID-19 model to create a projection of the number of cases in Sacramento during Q1 2022. Previously, we had modeled different relative transmissibilities of the Omicron variant. Since the original release of this blog post, more information has been released about the relative transmissibility and effectiveness of vaccines for the Omicron variant. Therefore we have run a single scenario for Q1 2022, where the Omicron variant is 1.6 times as transmissible as the Delta variant and vaccines are 10%-75% as effective at preventing transmission compared to the original strain. In this scenario we predict that the peak number of cases will occur at the beginning of February 2022. The maximum number of daily cases predicted by the model is ~2,500 cases per day.
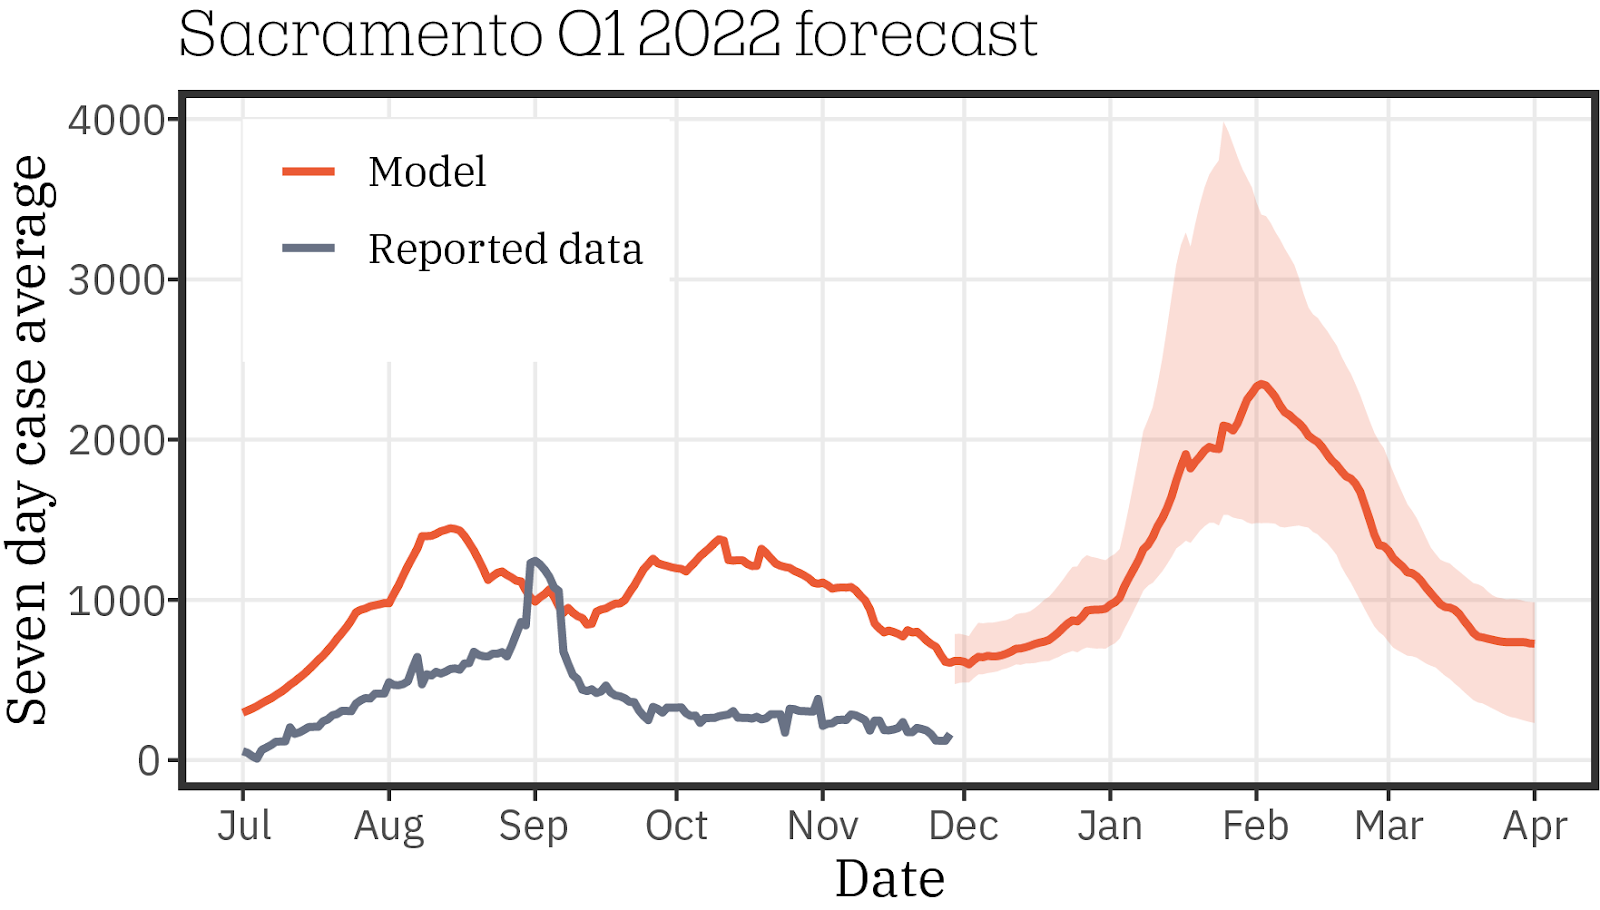
Time series of COVID-19 case numbers (seven-day moving average) from July 2021 to April 2022 for Sacramento, CA. Reported values are shown in gray (Center for Systems Science and Engineering (CSSE) at Johns Hopkins University, 2021). The colored line shows the number of cases predicted by our simulation model.
San Antonio, TX
The 2020/2021 winter wave in San Antonio peaked on January 16, 2021. Cases declined sharply, reaching a minimum on February 18. Cases stayed low and steady through spring and summer before a new wave of cases due to the increasing dominance of the Delta variant of SARS-CoV-2 began in July 2021. At its peak, the Delta wave produced approximately 2,000 new reported cases of COVID-19 per day in San Antonio.
As of January 20, 2022:
- 62% of San Antonio residents have completed their full course of COVID-19 vaccinations
- 298,254 residents (19% of the population) have received booster shots
An individual’s immunity to SARS-CoV-2 is influenced by both their vaccination history and whether or not they have previously been infected with the disease. Population-level immunity to SARS-CoV-2 (or ‘resiliency’) can be estimated using our model. Each simulated individual in the model has a resistance to infection by each strain of SARS-CoV-2 represented by a percentage. The population-level immunity of San Antonio residents is the average resistance to infection across all agents and strains, taking into account the prevalence of each strain. We estimate that San Antonio has 71% immunity to SARS-CoV-2 As of January 20, 2022. This is a medium level of immunity compared to other modeled locations in the United States.
We have used our COVID-19 model to create a projection of the number of cases in San Antonio during Q1 2022. Previously, we had modeled different relative transmissibilities of the Omicron variant. Since the original release of this blog post, more information has been released about the relative transmissibility and effectiveness of vaccines for the Omicron variant. Therefore we have run a single scenario for Q1 2022, where the Omicron variant is 1.6 times as transmissible as the Delta variant and vaccines are 10%-75% as effective at preventing transmission compared to the original strain. In this scenario we predict that the peak number of cases will occur at the beginning of February 2022. The maximum number of daily cases predicted by the model is ~7,400 cases per day.

Time series of COVID-19 case numbers (seven-day moving average) from July 2021 to April 2022 for San Antonio, TX. Reported values are shown in gray (Center for Systems Science and Engineering (CSSE) at Johns Hopkins University, 2021). The colored line shows the number of cases predicted by our simulation model.
Boston, MA
The 2020/2021 winter wave in Boston peaked on January 12, 2021. Cases then declined throughout January and February before increasing again in March. Cases declined steadily and reached a minimum by June. A new wave of cases due to the increasing dominance of the Delta variant of SARS-CoV-2 began in July 2021. At its peak, the Delta wave produced approximately 200 reported cases of COVID-19 per day in Boston.
As of January 20, 2022:
- 70% of Boston residents have completed their primary course of COVID-19 vaccinations
- 1,335,138 residents (29% of the population) have received booster shots
An individual’s immunity to SARS-CoV-2 is influenced by both their vaccination history and whether or not they have previously been infected with the disease. Population-level immunity to SARS-CoV-2 (or ‘resiliency’) can be estimated using our model. Each simulated individual in the model has a resistance to infection by each strain of SARS-CoV-2 represented by a percentage. The population-level immunity of Boston residents is the average resistance to infection across all agents and strains, taking into account the prevalence of each strain. We estimate that Boston has 71% immunity to SARS-CoV-2 As of January 20, 2022. This is a medium level of immunity compared to other modeled locations in the United States.
We have used our COVID-19 model to create a projection of the number of cases in Boston during Q1 2022. Previously, we had modeled different relative transmissibilities of the Omicron variant. Since the original release of this blog post, more information has been released about the relative transmissibility and effectiveness of vaccines for the Omicron variant. Therefore we have run a single scenario for Q1 2022, where the Omicron variant is 1.6 times as transmissible as the Delta variant and vaccines are 10%-75% as effective at preventing transmission compared to the original strain. In this scenario we predict that the peak number of cases will occur in the middle of February 2022. The maximum number of daily cases predicted by the model is ~8,400 cases per day.

Time series of COVID-19 case numbers (seven-day moving average) from July 2021 to April 2022 for Boston, MA. Reported values are shown in gray (Center for Systems Science and Engineering (CSSE) at Johns Hopkins University, 2021). The colored line shows the number of cases predicted by our simulation model.
Dallas, TX
The 2020/2021 winter wave in Dallas peaked on January 16, 2021. Cases declined sharply in the second half of January and remained low until the middle of July. A new wave of cases due to the increasing dominance of the Delta variant of SARS-CoV-2 began in August 2021. At its peak, the Delta wave produced approximately 1,200 reported cases of COVID-19 per day in Dallas.
As of January 20, 2022:
- 57% of Dallas residents have completed their primary course of COVID-19 vaccinations
- 601,454 residents (17% of the population) have received booster shots
An individual’s immunity to SARS-CoV-2 is influenced by both their vaccination history and whether or not they have previously been infected with the disease. Population-level immunity to SARS-CoV-2 (or ‘resiliency’) can be estimated using our model. Each simulated individual in the model has a resistance to infection by each strain of SARS-CoV-2 represented by a percentage. The population-level immunity of Dallas residents is the average resistance to infection across all agents and strains, taking into account the prevalence of each strain. We estimate that Dallas has 73% immunity to SARS-CoV-2 As of January 20, 2022. This is a medium level of immunity compared to other modeled locations in the United States.
We have used our COVID-19 model to create a projection of the number of cases in Dallas during Q1 2022. Previously, we had modeled different relative transmissibilities of the Omicron variant. Since the original release of this blog post, more information has been released about the relative transmissibility and effectiveness of vaccines for the Omicron variant. Therefore we have run a single scenario for Q1 2022, where the Omicron variant is 1.6 times as transmissible as the Delta variant and vaccines are 10%-75% as effective at preventing transmission compared to the original strain. In this scenario we predict that the peak number of cases will occur at the end of February 2022. The maximum number of daily cases predicted by the model is ~9,000 cases per day.

Time series of COVID-19 case numbers (seven-day moving average) from July 2021 to April 2022 for Dallas, TX. Reported values are shown in gray (Center for Systems Science and Engineering (CSSE) at Johns Hopkins University, 2021). The colored line shows the number of cases predicted by our simulation model.
Chicago, IL
The 2020/2021 winter wave in Chicago peaked on November 16, 2020, and again on January 8, 2021. Cases then declined throughout January and February, reaching a minimum on February 18. Following a slight increase in cases in March, cases were low again by June. A new wave of cases due to the increasing dominance of the Delta variant of SARS-CoV-2 began in September 2021. At its peak, the Delta wave produced approximately 1,000 reported cases of COVID-19 per day in Chicago.
As of January 20, 2022:
- 69% of Chicago residents have completed their primary course of COVID-19 vaccinations
- 1,284,288 residents (25% of the population) have received booster shots
An individual’s immunity to SARS-CoV-2 is influenced by both their vaccination history and whether or not they have previously been infected with the disease. Population-level immunity to SARS-CoV-2 (or ‘resiliency’) can be estimated using our model. Each simulated individual in the model has a resistance to infection by each strain of SARS-CoV-2 represented by a percentage. The population-level immunity of Chicago residents is the average resistance to infection across all agents and strains, taking into account the prevalence of each strain. We estimate that Chicago has 69% immunity to SARS-CoV-2 as of January 20, 2021. This is a medium level of immunity compared to other modeled locations in the United States.
We have used our COVID-19 model to create a projection of the number of cases in Dallas during Q1 2022. Previously, we had modeled different relative transmissibilities of the Omicron variant. Since the original release of this blog post, more information has been released about the relative transmissibility and effectiveness of vaccines for the Omicron variant. Therefore we have run a single scenario for Q1 2022, where the Omicron variant is 1.6 times as transmissible as the Delta variant and vaccines are 10%-75% as effective at preventing transmission compared to the original strain. In this scenario we predict that the peak number of cases will occur at the beginning of February 2022. The maximum number of daily cases predicted by the model is ~11,100 cases per day.

Time series of COVID-19 case numbers (seven-day moving average) from July 2021 to April 2022 for Chicago, IL. Reported values are shown in gray (Center for Systems Science and Engineering (CSSE) at Johns Hopkins University, 2021). The colored line shows the number of cases predicted by our simulation model.
Washington, DC
The 2020/2021 winter wave in Washington, DC peaked on January 13, 2021. Cases declined slightly through January, then stayed up and steady through March. Cases reached a minimum in June before a new wave of cases due to the increasing dominance of the Delta variant of SARS-CoV-2 began in July 2021. At its peak, the Delta wave produced approximately 300 new reported cases of COVID-19 per day in Washington, DC.
As of January 20, 2022:
- 71% of Washington, DC residents have completed their full course of COVID-19 vaccinations
- 1,775,803 residents (32% of the population) have received booster shots
An individual’s immunity to SARS-CoV-2 is influenced by both their vaccination history and whether or not they have previously been infected with the disease. Population-level immunity to SARS-CoV-2 (or ‘resiliency’) can be estimated using our model. Each simulated individual in the model has a resistance to infection by each strain of SARS-CoV-2 represented by a percentage. The population-level immunity of Washington, DC residents is the average resistance to infection across all agents and strains, taking into account the prevalence of each strain. We estimate that Washington, DC has 67% immunity to SARS-CoV-2 as of January 20, 2022. This is a medium level of immunity compared to other modeled locations in the United States.
We have used our COVID-19 model to create a projection of the number of cases in Dallas during Q1 2022. Previously, we had modeled different relative transmissibilities of the Omicron variant. Since the original release of this blog post, more information has been released about the relative transmissibility and effectiveness of vaccines for the Omicron variant. Therefore we have run a single scenario for Q1 2022, where the Omicron variant is 1.6 times as transmissible as the Delta variant and vaccines are 10%-75% as effective at preventing transmission compared to the original strain. In this scenario we predict that the peak number of cases will occur at the end of January 2022. The maximum number of daily cases predicted by the model is ~13,500 cases per day.
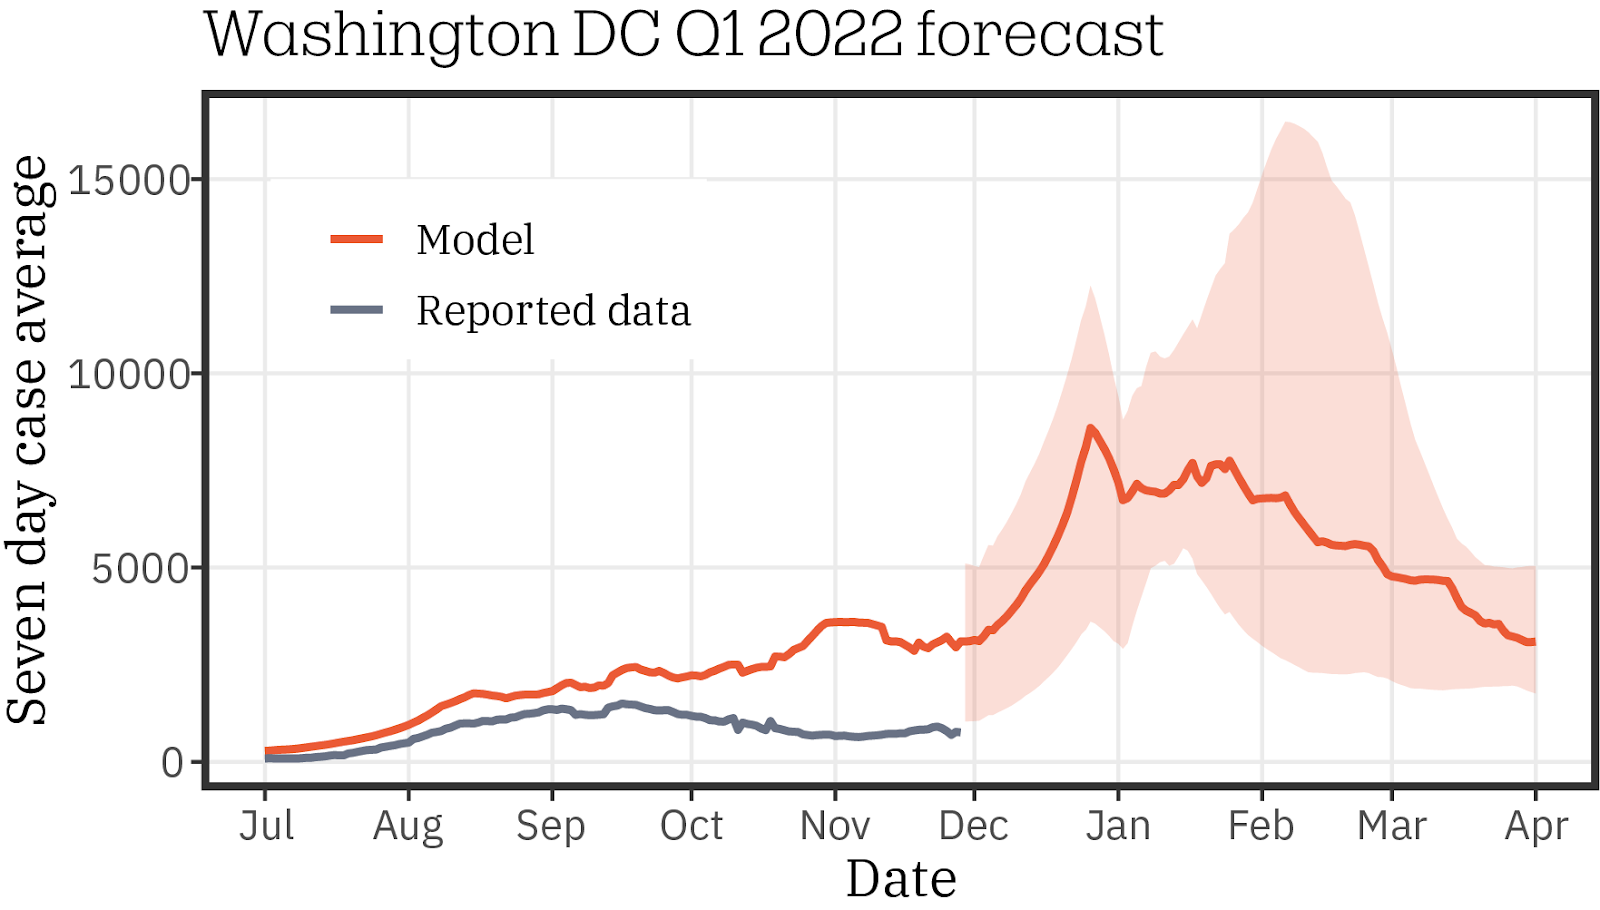
Time series of COVID-19 case numbers (seven-day moving average) from July 2021 to April 2022 for Washington, DC. Reported values are shown in gray (Center for Systems Science and Engineering (CSSE) at Johns Hopkins University, 2021). The colored line shows the number of cases predicted by our simulation model.
References
Center for Systems Science and Engineering (CSSE) at Johns Hopkins University. (2021). COVID-19 Data Repository. https://github.com/CSSEGISandData/COVID-19
Jalal, H., Lee, K., & Burke, D. S. (2021). Prominent Spatiotemporal Waves of COVID-19 Incidence in the United States: Implications for Causality, Forecasting, and Control. MedRxiv, 2021.06.29.21259726. https://doi.org/10.1101/2021.06.29.21259726