When the Spanish flu tore through the United States in 1918, it devastated the country, infecting almost a third of the nation and killing more than half a million Americans (five times more than World War I). For decades, many epidemiologists saw the devastation that the Spanish flu left in its wake as evidence that the mitigation measures put in place by public-health officials didn’t really matter all that much. Philadelphians wore masks, closed schools, and banned public gatherings, but so many thousands of people died that the streets were stacked with rotting corpses. That isn’t a strong endorsement of social distancing’s efficacy.
But it turns out these analyses were missing something crucial: the importance of timing.
In a groundbreaking 2007 paper, Richard J. Hatchett, Carter E. Mecher, Marc Lipsitch, and Lisa Koonin* showed how the fate of American cities in the 1918 pandemic depended on when local authorities instituted social-distancing policies. St. Louis put strong mitigation measures in place before the virus had time to establish a foothold and had half as many deaths as Philadelphia. Wherever leaders implemented mitigation measures early, they worked astonishingly well. But by the time disease was running rampant in your city, it was already too late.
What does this mean for COVID-19? That’s the question Epistemix president Don Burke and his colleagues Hawre Jalal and Kyu Lee at the University of Pittsburgh set out to examine by mapping how the virus spread across North America.
As Don explains in his recent Chicago Tribune op-ed, “By analyzing daily COVID-19 case data in the United States, Mexico and Canada, we found four continental-scale epidemic wave patterns that spanned county, state and international borders. These analyses provide evidence that seasonal factors, like weather changes, play a major role in determining local COVID-19 incidence rates. There is strong emerging evidence that the seasonal wave patterns observed during the first year of the epidemic are repeating again this year, and are likely to repeat into subsequent years.”
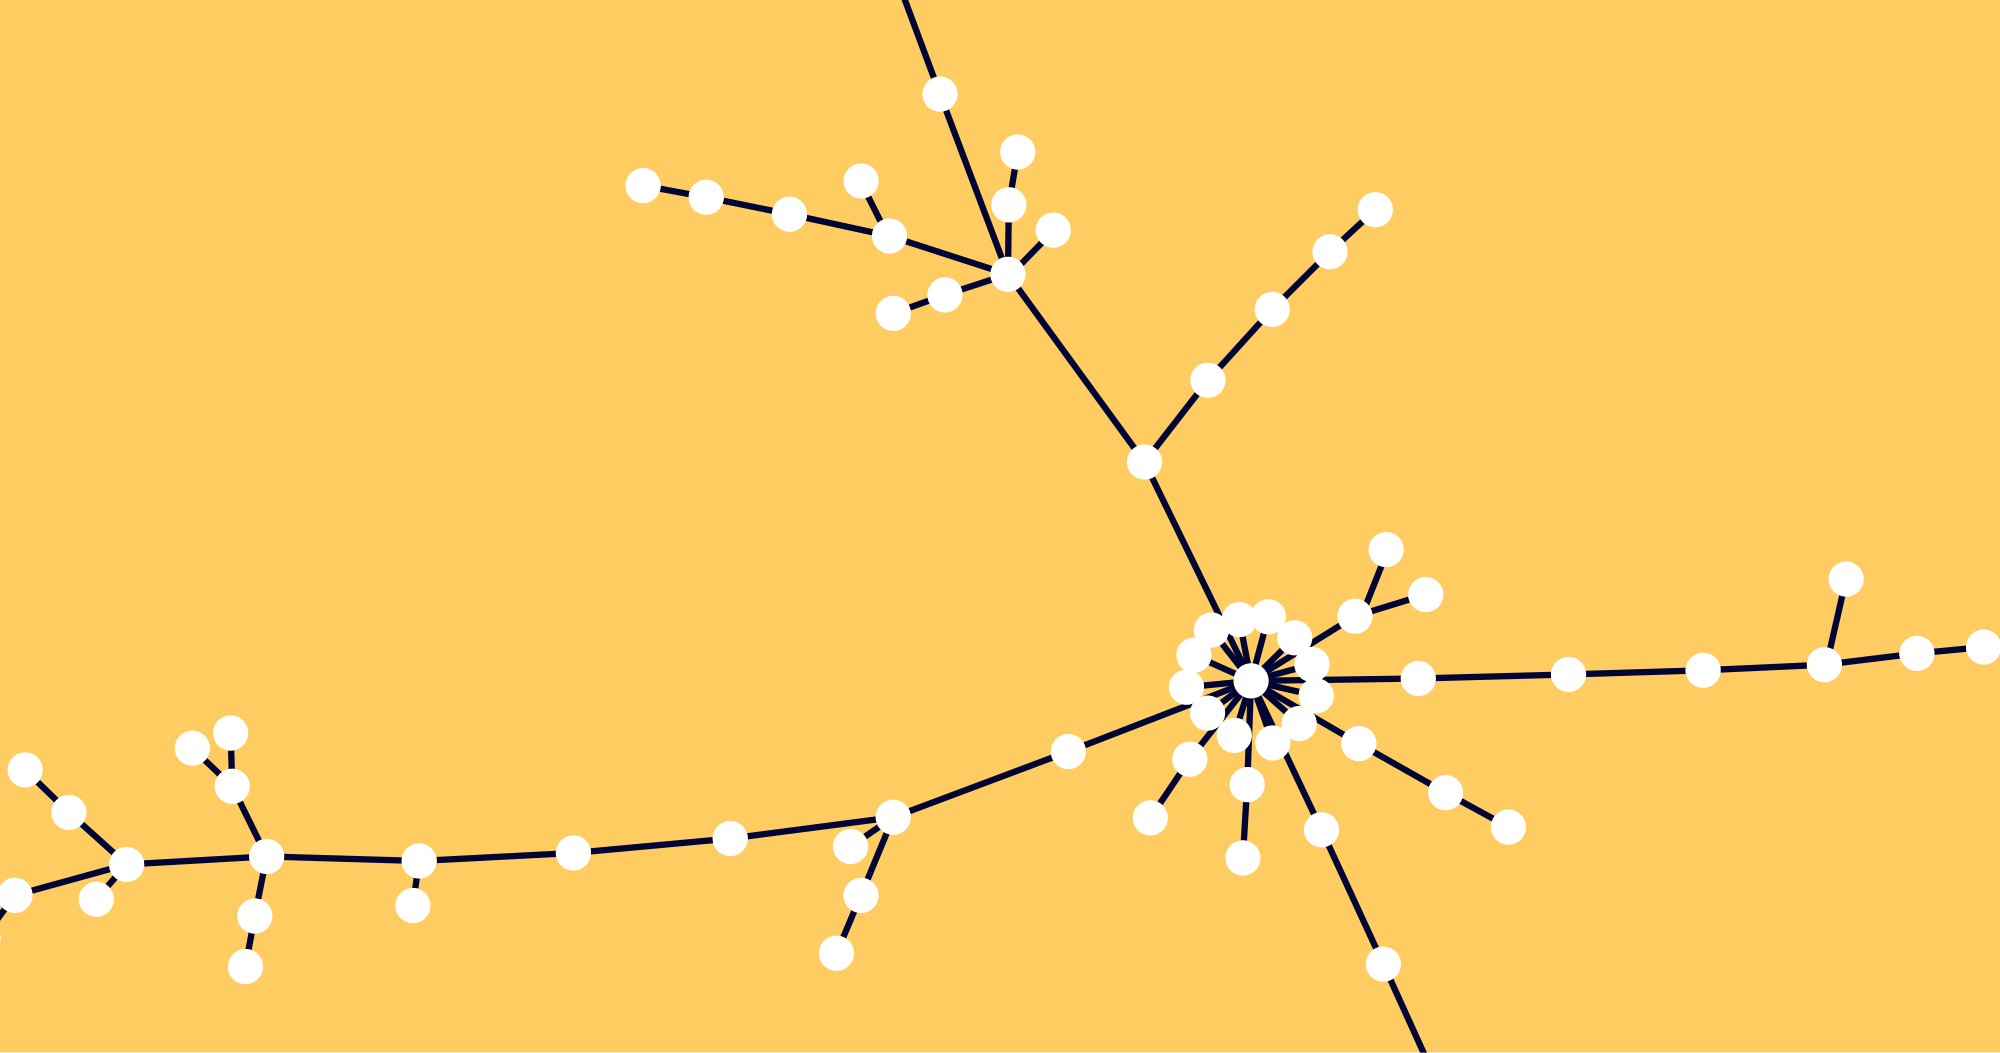
The visualization below displays county-level data from September 1 through December 31, 2020.
Below, you can watch the same story play out across all of North America. Note how the pandemic doesn't respect county, state, or national borders.

If you look carefully, you can see the virus rippling out across large swaths of the continent, giving you the advance warning you need to implement mitigation measures while there’s still time for them to work.
Right now, local, state, and national officials are responding to COVID-19 largely based on the infection, hospitalization, and death rates in their respective jurisdictions. These results suggest they should pay more attention to regional trends.
While it isn't part of the formal study, the visual correlation of COVID-19 cases to regional weather patterns is striking, per the side-by-side below. This is seasonality at work: weather changes people's behavior, and people's behavior changes the course of the epidemic.
Overall, these findings are a call-to-action to step back and look at the bigger picture if you want to understand how the pandemic will impact your community this fall.
“Our next scientific challenge is to understand how these important, large-scale epidemic wave patterns are generated and propagated,” Don writes. “If we can figure out what is driving these continental epidemic waves, we should be able to forecast surges of COVID-19 and possibly even prevent them from occurring.”
The team at the University of Pittsburgh is tackling that scientific challenge head-on, and here at Epistemix, we are incorporating their findings into our COVID-19 models and using the results to help companies and governments plan ahead.
Timing is everything. If you had bought $1,000 of Apple stock in July, 1982, your investment would be worth more than $3 million today. The problem, as any investor will tell you, is knowing when to buy and when to sell.
Leaders face the same challenge when it comes to protecting those they serve from infectious disease: Act too soon and you risk causing unnecessary disruption to people’s lives. Act too late and you risk their lives.
That dynamic is as true today as it was in 1918. The difference is that now we have more and better tools for understanding not just how diseases work and why they spread, but when we can intervene to make a real impact.
*We recently partnered with Lisa and her team at Health Preparedness Partners on a joint study that quantifies the impact of different vaccine policies on the return-to-office across ten major American cities.