Long-term planning is hard. The future is uncertain, so if you want to be prepared, you need to consider a broad spectrum of potential outcomes. Many of those potential outcomes involve significant changes from the status quo, which limits the utility of forecasting tools that extrapolate from past data under the assumption that the future will generally be like the past.
These challenges are at the heart of strategic decisions about resource allocation and investment. Businesses need to make decisions in the present based on their expectations of future conditions. And although future conditions certainly depend on current conditions, they also depend on a lot of other factors like the actions of competitors and the state of the broader economy that are hard to predict with any certainty. So the way to maximize your probability of success is to make plans that are robust to a wide variety of possible futures.
Internet service providers (ISPs) offer an instructive example. When ISPs enter new markets or expand their offerings in existing markets, they must make significant investments in physical infrastructure based on projected demand three or even five years in the future.
Current demand can help inform those projections, but a lot can change in three years! What if a global pandemic changes household internet usage patterns when a significant portion of the population shifts to working or studying from home? What if a new virtual reality technology comes out that requires much faster download speeds? What if a rival provider introduces a competing service at a lower price? To make things even more difficult, the answers to these strategic questions vary by region, and ISPs must make geographically specific investment decisions—they can’t retreat into generalities.
Ultimately, ISPs need to anticipate how the future will differ from the past in important ways in particular places, so we developed an agent-based model of internet usage in Boulder County, Colorado to do just that.
Agent-based modeling is a complementary approach to standard statistical modeling. Whereas standard statistical modeling generally involves identifying and describing current trends—and possibly projecting them into the future to make predictions—agent-based modeling involves building and running computer models that simulate the real-world behaviors of and interactions between people (i.e. agents) that generate those trends.
The benefit of combining statistical and agent-based modeling is considerable. For example, agent-based models are often more useful than statistical models for uncovering why a specific trend has emerged. Furthermore, good agent-based models are more adept at forecasting outcomes in futures that are different from the past because they can anticipate how agents may react to novel situations in ways that statistical models cannot. Leveraging both statistical and agent-based modeling to simulate how the future might be different under a wide range of scenarios would give the right ISP a competitive edge across its portfolio.
Building a Model of the Present
The first step toward projecting possible futures is to represent the past and the present in a computer simulation. Our modeling platform comes equipped with a synthetic population that has a distribution of demographic characteristics like age, sex, race, and household income matching the current US population. Each of those virtual people—i.e. agents— has a virtual household, workplace, school, etc.
We wanted to understand the future of internet usage in Boulder. So we determined a weekly schedule of internet usage activities—e.g. streaming music, gaming, and using social media—for agents to follow in simulations (the details of each individual agent’s schedule depend on their demographic characteristics). Then we associated agent households with an internet service—i.e. a download speed, a technology by which internet service is delivered (e.g. hybrid-fiber coax network, fiber-to-the-home network), an ISP, and a monthly subscription price.
To make the simulation as realistic as possible, we incorporated external data from various sources into the model. For example, we used data from the FCC that records the internet services available in each census block. We loaded that data into our platform to reference when we assigned an internet service to an agent’s household, and when agents choose a new service to upgrade or downgrade to during the course of the simulation. We also used publicly-available data on prices of different internet services in the Boulder area to assign a realistic price to each service.
By tapping these external data sources, we can be confident that the pool of internet services available to the agents in a given location represents a realistic menu of options, just as our synthetic population of agents represents a realistic community of people who live in that area. In addition to these independent quantitative sources, we also incorporated qualitative insights from industry experts to inform modeling decisions like “What important variables do people consider when they evaluate whether they are happy with their current internet service?”
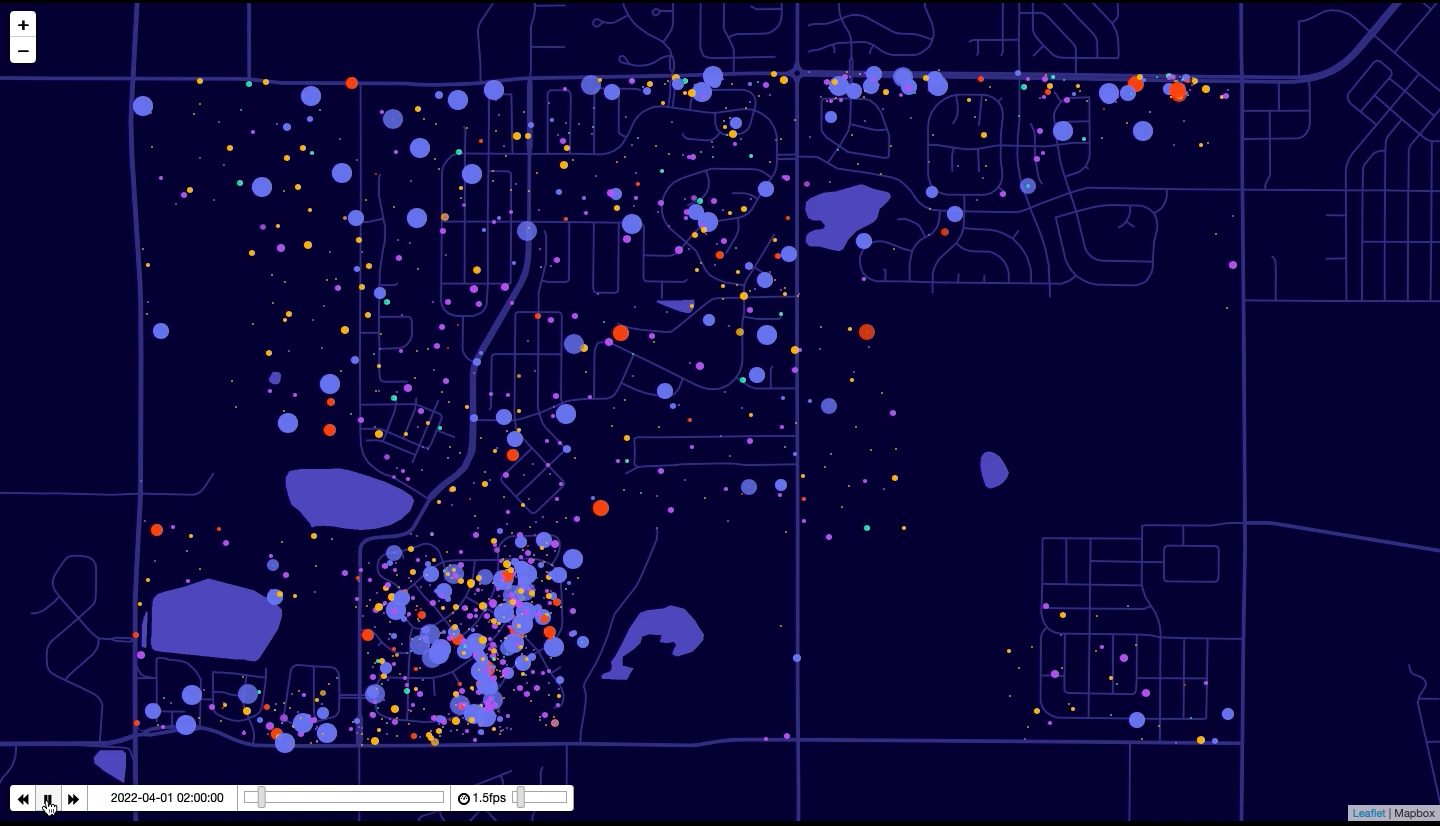
On the map below, each dot corresponds to a household from our synthetic population in this Boulder-area neighborhood. The color and size of each dot corresponds to the technology and download speed, respectively, of that household’s internet service.
Forecasting a Baseline Future
After building a realistic model of the present, we can begin to explore possible futures. A natural place to start is to establish a simple baseline: What might the future look like if things continue more or less as they are right now?
We went ahead and ran that simulation. Agents in the model go about their daily lives, hour-by-hour, and use the internet according to their demographically-determined schedules. Households record various aspects of their internet usage habits, including average monthly data usage and instances of “overages” when the sum of the activities by all members of the household exceeds the parameters of their service at a given point in time. Households also reevaluate their internet service once per year, deciding whether to upgrade, downgrade, or keep their internet service by considering a variety of factors like the frequency of overages and whether they are paying significantly more for their service than their neighbors.
One powerful benefit of agent-based models is the ability to build up population-level trends from individual-level decisions and actions. So, for example, we aggregated household-level decisions about choosing an internet service for the next year into a higher-level projection of the market share of different service technologies in each census block group (visualized below) and extrapolated the evolution of those market shares over time.
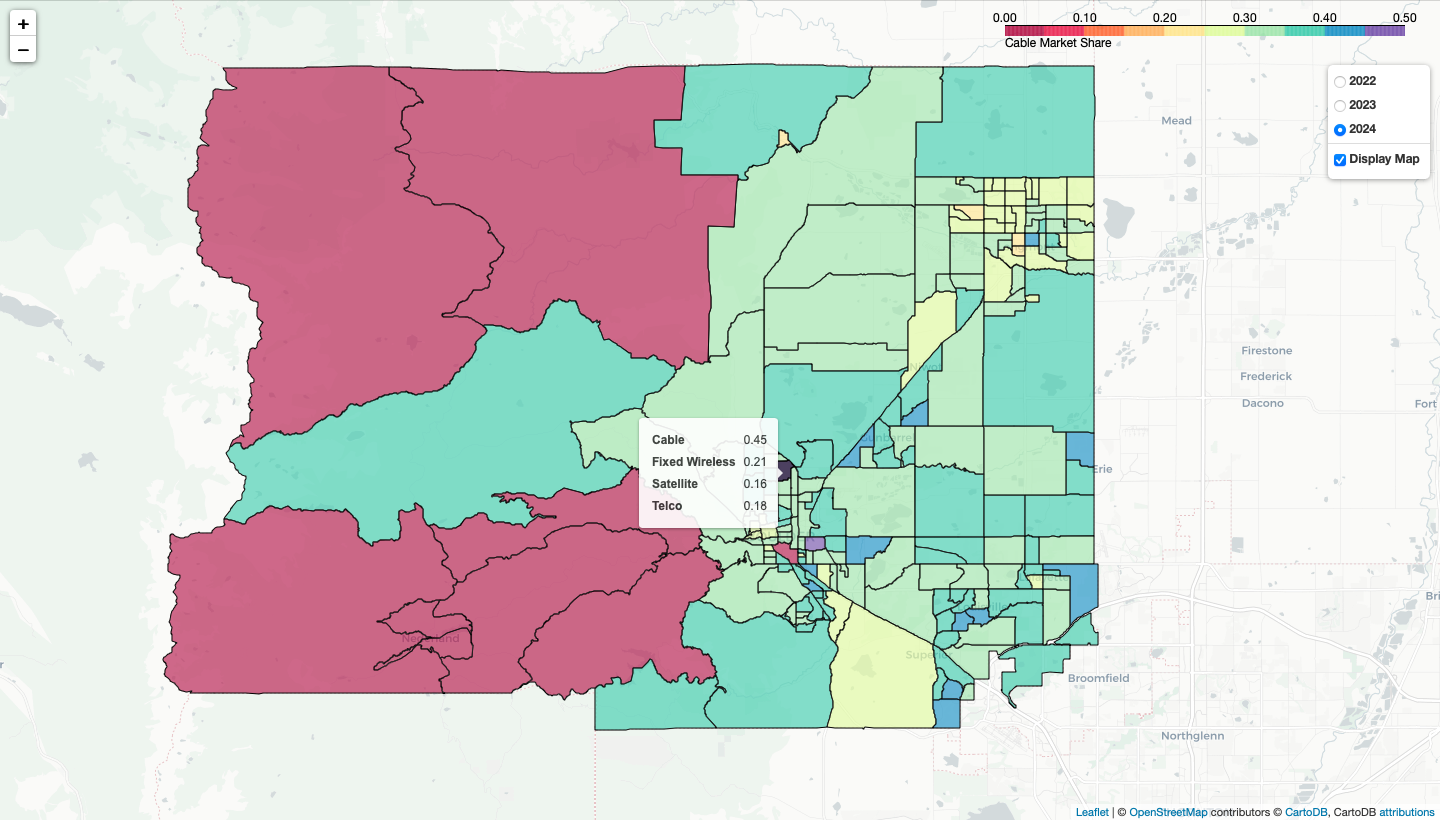
Projections like this can be used to inform long-term investment strategies by helping to identify areas where service can be improved. Furthermore, since the simulation involves multiple levels of granularity, you can ask why a trend is occurring in a way that is generally not possible in standard statistical models. In this particular model, if you identify a region in which a specific technology is projected to lose market share, you can return to the household-level view from the block-group-level view and ask why individual agents are choosing to adopt other technologies. After understanding the why, you can identify strategies for avoiding this result in the real-world future.
This kind of projection can also serve as a baseline against which to compare alternative futures, both in the real world and in the model: How would the projected market share change if a provider introduced a new service into a particular census block group?
Exploring Alternative Futures
Given the baseline future where things more or less stay the same, we are now ready to imagine alternative futures that depart from that baseline.
For example, we can consider how the future might be different from our baseline in a world where a competing ISP enters a given market. This kind of projection helps in estimating the potential value of a particular investment by allowing us to consider how that value might differ across a range of possible outcomes.
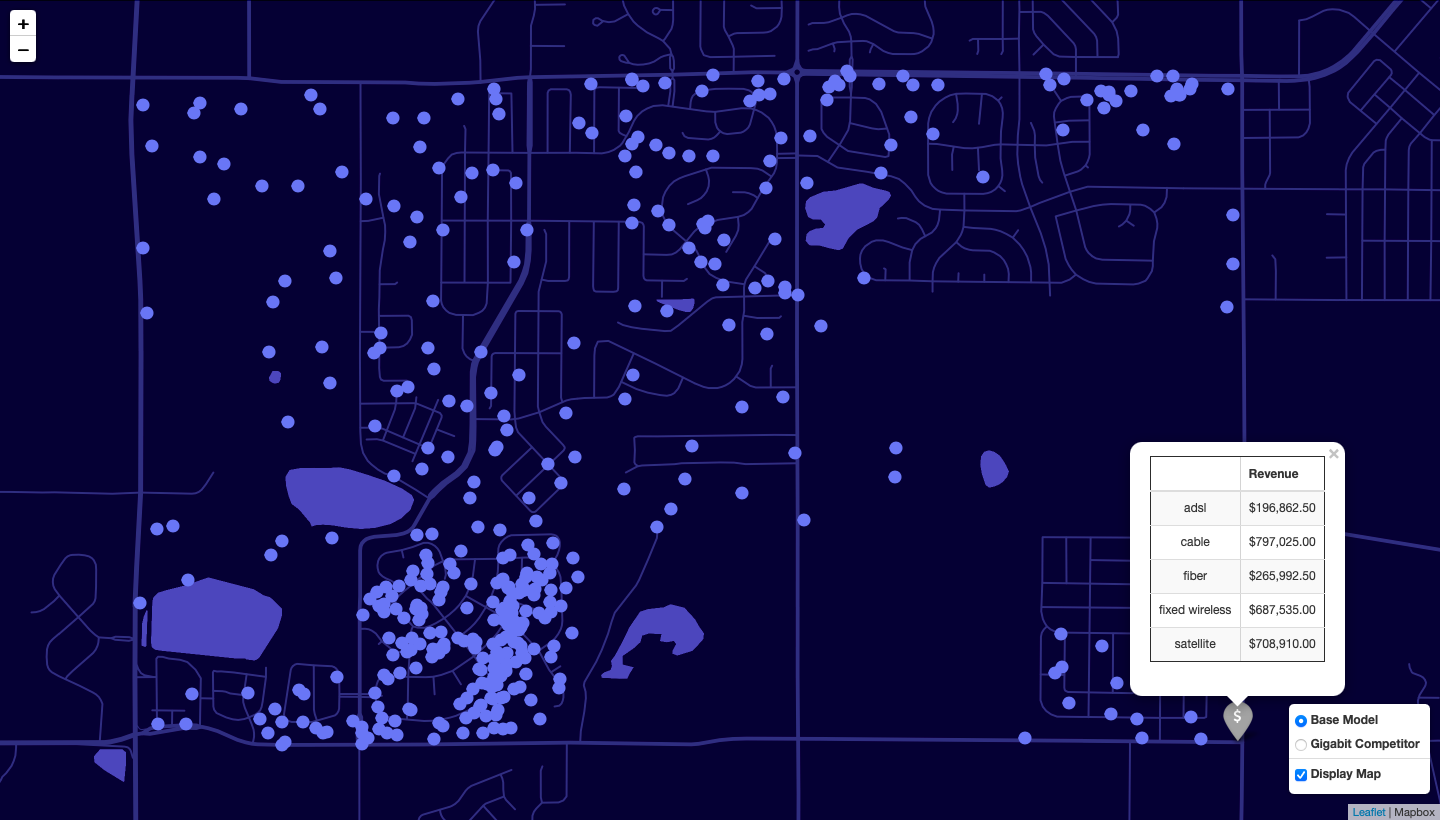
Let’s return to our Boulder-area neighborhood. According to the FCC data, only a single cable ISP currently provides gigabit service (internet service with a download speed of 1000 Mbps or faster) in that neighborhood. The following figure, which visualizes our baseline future, illustrates this. All households who are gigabit subscribers at the end of our baseline simulation are shown on the map. The color of the dots, blue for all households, represents the fact that their internet service technology is cable. The figure also shows a mock projection of the revenue earned by providers in the neighborhood.
How might this change if a competitor offered gigabit service in that neighborhood one year into the future? We can easily extend our model to explore that scenario!
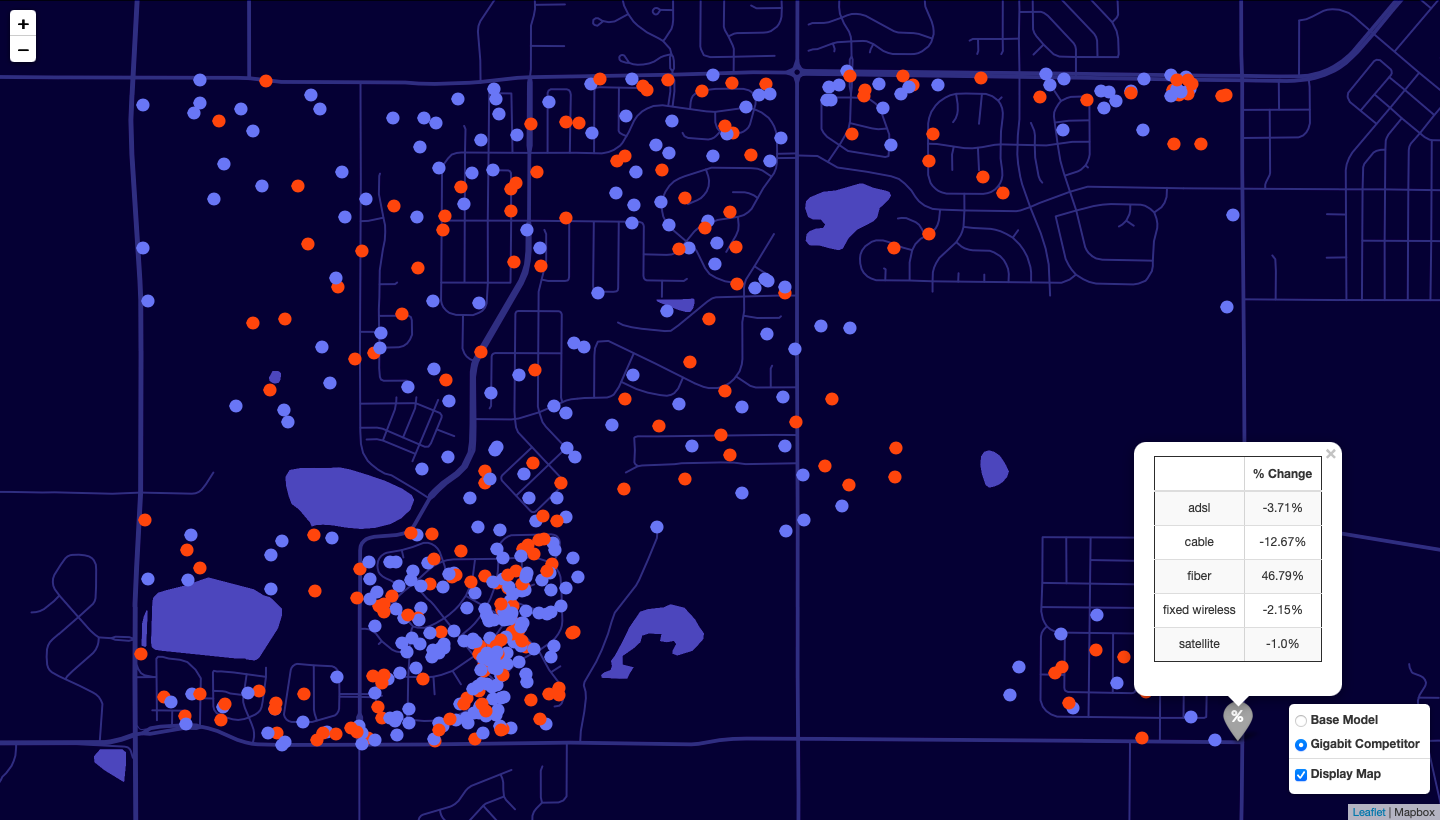
The following figure visualizes this alternative future. In it, one year into the simulation, a telecommunications company begins to offer competing gigabit service in our neighborhood via fiber-optic cable at a slightly lower price. As before, households with gigabit service via cable are represented with blue dots. Households with gigabit service via fiber-optic cable are represented with red dots. We can see that, in this alternative future, there are more total gigabit subscribers in the neighborhood than in the baseline. And some agents who would have been cable customers became fiber customers instead. These differences have implications for our mock revenue projections as well—the change-in-projected-revenue relative to the baseline future for each technology is documented in the table in the lower right corner of the figure.
ISPs can use insights like these to inform long-term investment theses. For example, the observation that the total number of gigabit subscribers is higher when there are two providers might suggest to the cable ISP that they could increase their revenue in either scenario by slightly reducing the price of their gigabit service or by running a special discount for a limited time in order to acquire more gigabit customers. Even better, you can build those scenarios into the model to extrapolate their implications and deepen your understanding of the range of possible futures.
Using Simulation to Plan Ahead
Long-term planning is hard, but it can be easier with the right tools. By building a realistic model that incorporates both synthetic and external data and insights, you can forecast trends across a range of possible scenarios without needing to assume that the future will resemble the past. And by evaluating a diverse range of alternative futures and asking why certain trends emerge or don’t, you can uncover key points of leverage for inventing the future your business seeks to realize.
Noah Burrell is an intern at Epistemix.