Simulating COVID-19 Reopening Policies
Problem
As the world grapples with the COVID-19 pandemic, organizations are trying to find the best paths forward. National, state, and local governments are making and updating social distancing policies. Health systems are mapping out staffing and equipment requirements to handle future waves of patients. Businesses are modifying operations and investments to accommodate extraordinary levels of uncertainty. While high-level case and fatality statistics offer useful context, they often fail to provide enough specificity to inform real-time decisions and policy interventions.
Solution
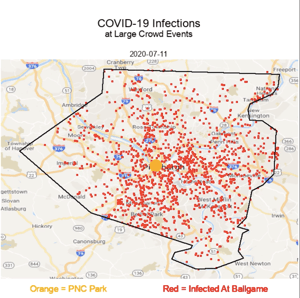
 Epistemix worked with a major American health insurer to model the epidemiological impacts of reopening PNC Park in Pittsburgh, PA for a baseball game. We used our platform to create a synthetic population that matched Allegheny County’s actual population statistics and demographics, including age, income, race, and household size. Then we parameterized, implemented, and analyzed the model using best-available epidemiological data and realistic social dynamics—tracing individual chains of transmission and partnering with the National Energy Technology Laboratory to calibrate the initial conditions and fit the model to real-world observed data. Finally, we simulated and forecasted the effects of reopening PNC Park for a baseball game under three scenarios: strict social distancing, relaxed social distancing, and moderate social distancing that balances health and economic priorities. Using ArcGIS, users can ingest Epistemix output to visualize the results of models, create maps and movies, and perform spatial-temporal analysis.
Results
Epistemix delivered model-derived insights despite the early state of the science of COVID-19 disease and incomplete data from fledgling reporting systems. We reached a number of surprising conclusions, like how reopening PNC Park for a baseball game accelerated the epidemic most dramatically under moderate social distancing conditions because it pushed the growth rate over the exponential threshold of R0=1. These results provide the specificity required to compare real policy interventions and inform crucial operational decisions. Moreover, we can use the same analytical approach to forecast the effects of any large social gathering—protests, rallies, celebrations—for any county in the United States, simulating the implications of the difficult choices leaders face.


